The Role of GIS in Public Health
As seen on GovLoop.
Geographic information systems (GIS) answer the question of where: where diseases are prevalent; where vulnerable populations live; and where resources are most needed to improve health conditions. GIS consists of the data, technology and people who answer these questions. And it has never been more relevant than it is today.
In the past year alone, health professionals have used it to address the COVID-19 pandemic, opioid epidemic, vaping-related respiratory illness and other diseases and injuries. GIS is helping public, private and non-profit organizations make effective and efficient decisions, from collecting data to analyzing it to presenting it in a user-friendly manner.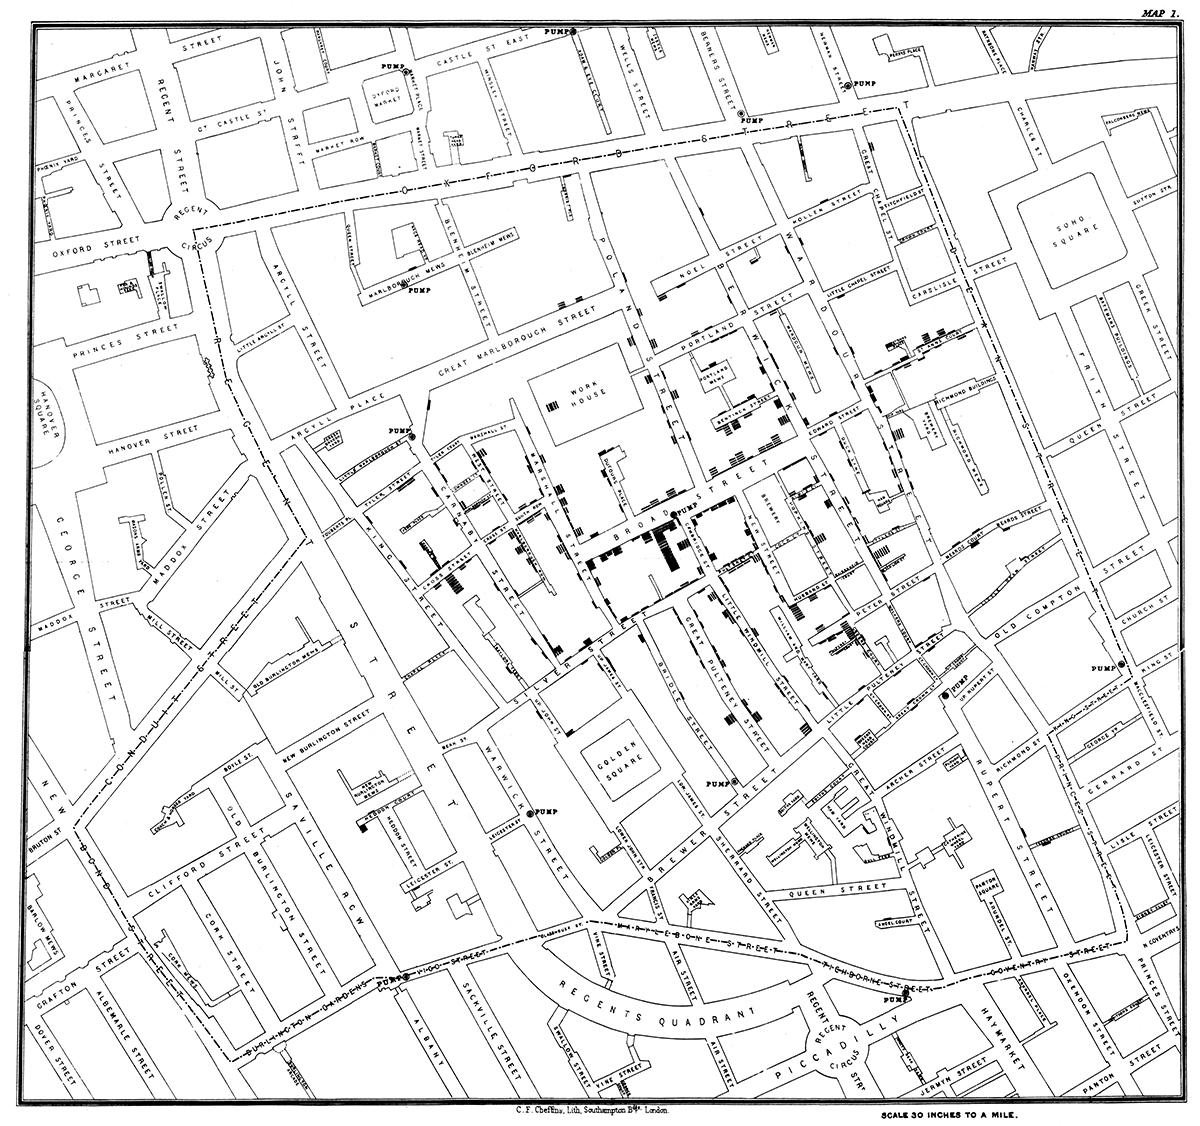
History of Mapping and Public Health
In the nineteenth century, John Snow was the first to use mapping in epidemiological research. In 1854, London suffered from an outbreak of cholera, and Snow mapped the locations of those stricken by the disease. By looking at where cholera victims lived, he observed a spatial pattern and identified the water source suspected of being responsible for the outbreak. This event marked the founding of epidemiology – the study of patterns, causes and distribution of diseases and health-related events.
This image is of John Snow’s map of cholera cases in London 1854.
Uses in Public Health
GIS benefits public health by:
- Collecting information. The prevention of disease is paramount in developing healthy individuals and communities. But first, we need to understand what conditions exist that compromise health and safety. Policymakers cannot make evidence-informed decisions without qualitative or quantitative data to back it up. To collect the data, for example, an app can be created in which users report signs of blight in their neighborhood, which municipal agencies can use to prioritize cleanup crews.
- Analyzing spatial patterns. Instances of disease can be mapped and analyzed to reveal patterns in its distribution, as evident in John Snow’s cholera map. But this just scratches the surface of GIS’ analytical capabilities. For example, you could use a proximity analysis to identify “food deserts” — an area that has limited access to affordable and nutritious food — in relation to schools or youth-centered establishments to help school districts create policies that make accessible nutrition a priority for students.
- Allocating resources. You wouldn’t want to build a hospital in an area where there are several others. Nor would you want to deprive a rural community of access to much needed health care. GIS enables planners to figure out the best location for health care services based on the population served.
- Presenting data in an easy-to-understand way. Most humans are visual beings, and looking at a map or data dashboard compared to reading rows of numbers is a good way to help users understand the distribution of health issues. For instance, it is easier to tell where there are cancer clusters in a region by a heat map than by looking at a spreadsheet.
GIS Tools
No matter which GIS software you use, four basic tools can help any public health professional in their role as a disease-fighting superhero:
- Maps — the most basic of GIS tools. It can contain geopolitical layers such as census tracts, zip codes, city council districts or health agency sub-regions. It can include layers of demographic data, such as the number of households that live below the area’s median income. And it can also include health data, such as the percentage of the population with a substance use disorder.
- Story maps. As the name implies, they narrate a story in a compelling way with maps, photographs, text, videos and charts.
- Crowdsourcing apps. These apps are a great way to collect data in the field by being accessible on a mobile device. The methodology in collecting the data is a good way to encourage people to be active and engaged stakeholders in their community.
- Data dashboards. These provide key insights on data. You can combine maps, charts, gauges, lists and text on a single computer screen to present data.
Even with all these tools, the most valuable asset in GIS is the public health professional – the one with the innovation and creativity to collect data, map it, analyze it and present it.
Author:
Meredith Gibson
Media Director, IPS
Meredith Gibson is the Media Director for the Binge and Underage Drinking Initiative, Countywide Media Advocacy Project, and Partnerships for Success. She generates news articles to promote awareness of public health issues, collaborates on opinion editorials (op-eds) with community leaders, and pitches ideas and spokespersons to news outlets, amassing media coverage at the local and national levels.


